Work · Built and running

Built and running: three examples of what we make.

Two reporting apps that read straight from a company's ERP (the business system that holds its accounts, stock and orders), and a practice management app for a medical practice. What goes into your portal is scoped in your assessment. Everything below is a real run, with the numbers it produced and the finished output itself, which you can open and use right here.

About the data

The data on this page is generated, not a client's. Both tools were run against a demonstration ERP database filled entirely with invented data: invented company, invented sites, invented stock codes, invented customers. No client data of any kind appears here and none ever will. What is real is the software and the run: these are the figures the engine produced on 09 November 2026, in the times stated, not a mock-up. Both finished files are linked below in full, exactly as the engine wrote them, so every figure on this page can be checked against the file it came from.

01  /  Month end pack

What happened last month, and what needs a decision.

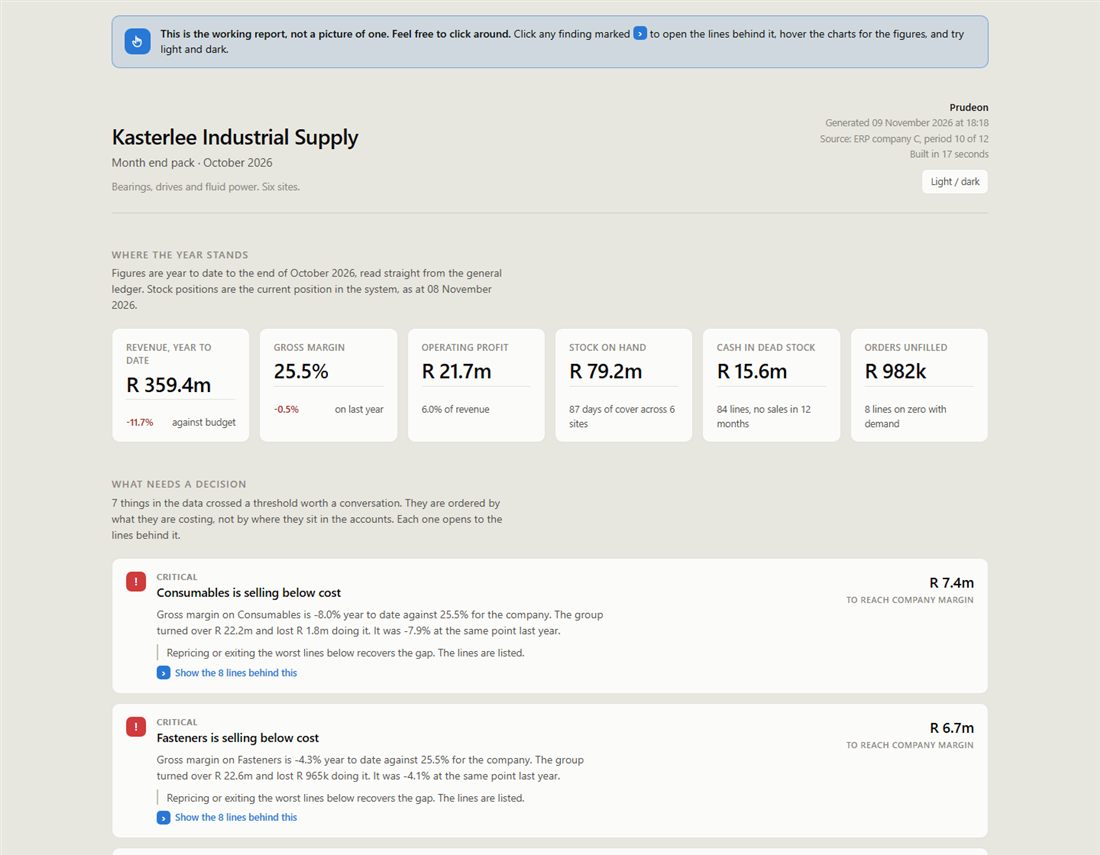
the month is closed, so what is in the numbers that somebody should act on? The pack ranks what crossed a threshold by what it is costing, and each finding opens to the lines behind it.

It runs on its own, on a schedule or on demand. It reads the client's own financial calendar out of the ERP, works out which period actually closed, and reports on that one.
Time to build the pack
17 seconds
From one command to a finished 57 KB file: the general ledger, the sales ledger, twelve trading periods and every stock position at six sites.
Findings on this run
7 findings
Three critical, three serious, one warning. Each is a rule against a configurable threshold, so the same code finds whatever is wrong at the next site, including nothing.
Largest single finding
R 15.6m
Sitting in 84 stock lines with no sale in twelve months. Flagged automatically because it crossed a threshold.
out/month-end-pack.htmlOpen the full file
The month end pack: six headline figures across the top, then the ranked list of findings, each one expandable to the stock lines behind it.

// Screenshot of out/month-end-pack.html, generated 09 November 2026 against the demonstration database. Invented data throughout.

Try the working report The picture above is a preview. Click it and the real report opens in a new tab, the same one a finance team would use, and you can work with it.

An income statement that ties

Month and year to date, actual against budget, built from stored period balances rather than re-aggregated transactions, so it agrees with what the ERP itself reports.

Revenue against plan

Twelve trading periods: actual, budget and the same months last year. Actual stops at the last closed period. Budget runs the full year, because a budget is approved before the year opens.

Where the margin goes

Margin by product group, turnover by site, customer concentration. On this run two groups were selling below cost and one customer was 18.5% of turnover.

Three reconciliation checks

Ledger revenue against invoiced sales, ledger history against ledger transactions, stock in transit against open transfers. Run on every build and printed whether they pass or not. All three agreed on this run.
02  /  Stock allocation

What should move where, this week.

one site is drowning in stock and another cannot fill its orders, so what goes on the truck? The month end pack reported that Durban was holding three times the cover of everywhere else. This is the tool that does something about it.

It reads every stock position at every site, works out what each site should be holding against its own demand rate and its own lead time, and writes a transfer list somebody can action before Friday. The method is printed on the dashboard itself, with the value every setting ran at, because a planner will not act on a number they cannot reproduce.

The plan it produced
653 lines
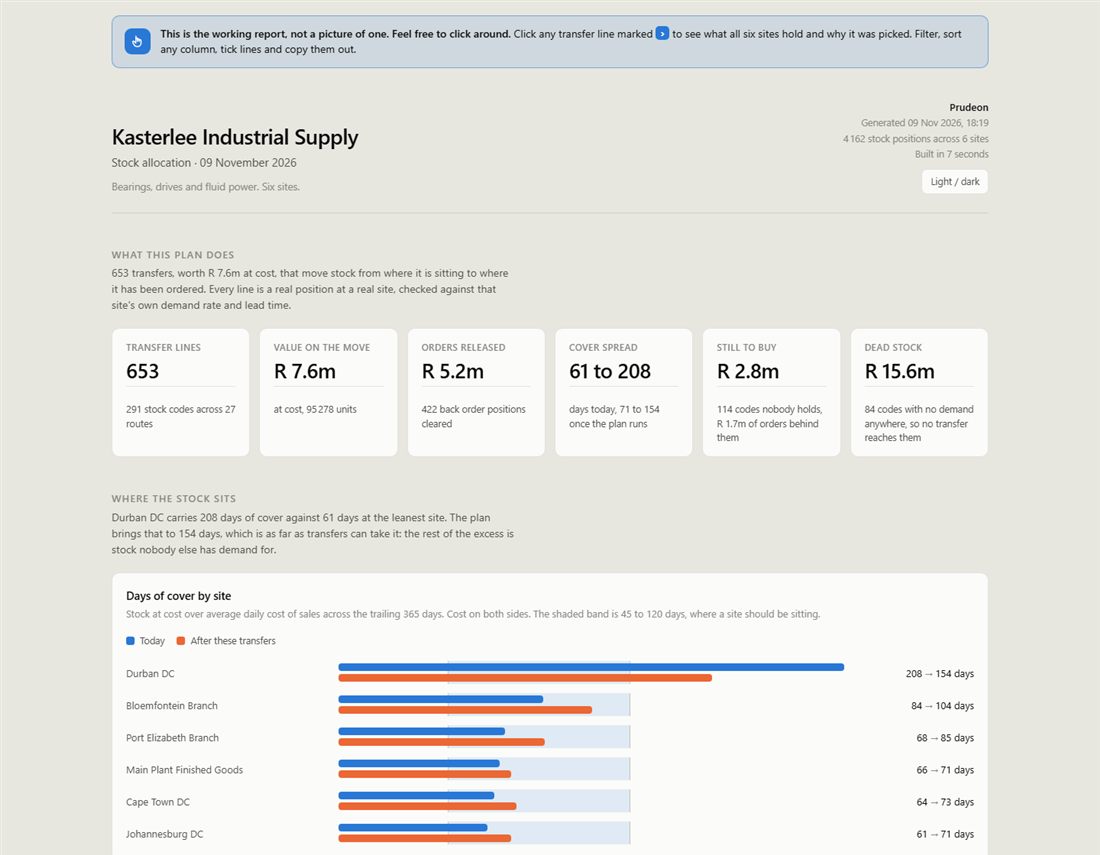
Worth R 7.6m at cost, 95 278 units, 291 stock codes across 27 routes. Read from 4 162 stock positions at six sites in 7 seconds.
Orders released
R 5.2m
422 back order positions cleared by moving stock the group already owned. Scarce stock goes to whoever runs out first, not to whoever asked for the most.
Durban cover, before and after
208 to 154
Days of cover. The rest of that excess is stock no other site has demand for, and the dashboard shows it separately.
out/stock-allocation.htmlOpen the full file
The stock allocation dashboard: six headline figures, then days of cover by site shown today against after the plan runs.

// Screenshot of out/stock-allocation.html, generated 09 November 2026 against the demonstration database. Invented data throughout.

Try the working dashboard The picture above is a preview. Click it and the real dashboard opens in a new tab, with all 653 transfer lines, and you can work with it.

A fair share engine, not a pro rata one

Where surplus does not cover need, back orders are cleared first, then every site is lifted to the same number of days of cover, and nobody is taken past their own requirement.

A buy list for the rest

Need that no site can fill becomes a buy list: on this run R 2.8m across 114 codes nobody holds, with R 1.7m of orders behind them.

Dead stock is reported, not moved

84 codes have no demand at any site, so every transfer of them would be a lorry trip that changes nothing. The dashboard lists them separately.

Three reconciliation checks

Group stock value is conserved, no site ships more than it had available, value despatched equals value received. All three agreed on this run.

03  /  Practice management

Running a busy practice from one screen.

how does a busy medical practice run its day without a paper diary, a shared calendar and a pile of sticky notes? This is a working demo of a practice system for a three-doctor GP practice, built to show what replaces all of that.

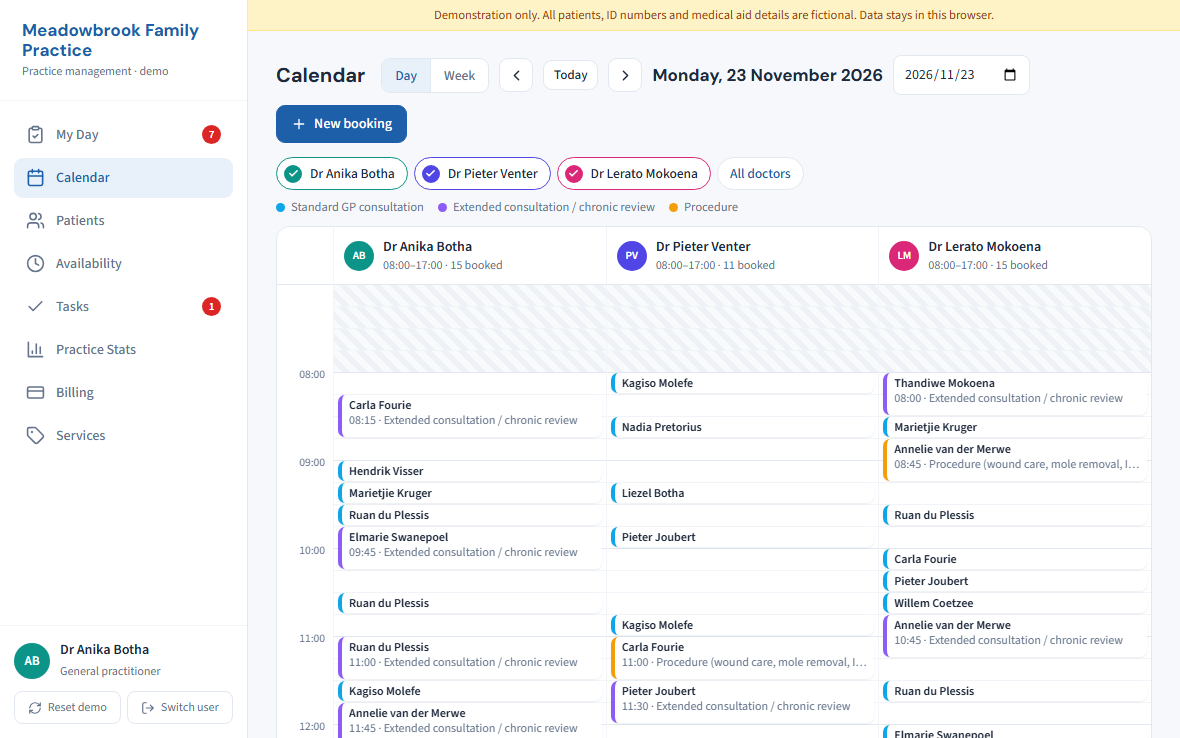
Reception books patients across all three doctors, drags appointments between them and works through one My Day list. Doctors open a patient's file, write notes from templates, and print scripts, sick notes and referral letters on the practice letterhead.

Who uses it
3 doctors
Plus reception, each with their own view: the calendars side by side, one doctor at a time, or a week view.
Front desk
1 list
Online booking requests, reminders to send, lab results to file, authorisations and repeat scripts, all on one My Day screen.
Safety checks
Built in
A script warns when a medicine clashes with a recorded allergy, and the SA ID number fills in the date of birth and checks itself.
practice / calendarOpen the demo
The practice calendar: three doctors side by side, each with the day's bookings colour-coded by type of consultation.

// Demonstration practice. Every doctor, patient, ID number and medical aid detail is invented, and anything you change stays in your own browser.

Try the practice app Sign in as a doctor or as Reception, no password needed. Reset demo (bottom left) puts the sample data back.

Bookings that respect the rules

Each doctor's hours, lunch and leave are set once, and only free times inside them can be booked. Turn a doctor off on a Friday and the calendar greys it out at once.

The patient file in one place

ID, medical aid card, allergies, chronic conditions and medication, upcoming visits, and every note and letter filed, searchable and filterable.

Documents on the letterhead

Notes from templates, scripts, sick notes and referral letters, each with a live preview, printed or saved as PDF. The sick note leaves out the diagnosis unless the patient consents.

Numbers the practice can use

Patients seen, new patients, fees billed and no-shows, by month and by doctor, with the busiest hours of the week shown as a heatmap.

// How they are built

One portal. Your sign-in. Checked on every run.

Both apps run on one server and live in one portal, which your people reach with their Microsoft work accounts. Every app added later goes into the same portal and runs on the same engine, which is why the second costs a fraction of the first.

Behind your Microsoft sign-in

People log in with the work accounts they already have. Each person sees only the reports and apps they are allowed to, and there is no separate password to manage.

Runs where you decide

The server sits on your own premises, with a managed host, or somewhere else, decided company by company. Your IT team can set it up with our guidance, or we can put you in touch with specialists who handle the server and backups from day one. No tracking, no analytics and nothing reported anywhere.

Read only against your ERP

Every query against the ERP is read only and built so that a report running at month end never slows down the people trying to close the month. The only tables we write to are the portal's own.

Configured, not rewritten

Everything that differs between installations sits in one settings module: company code, ledger groups, warehouses, financial calendar, thresholds, branding, planning assumptions. A new client gets their own copy of that one file, not new code.

Your data, our engine

You own your data and everything in it. We keep the engine and license it per company database: unlimited users, support and new versions, with every app in the portal included while the licence runs.

Two outputs, one engine

They share a connection layer, a financial calendar, a settings module and a visual identity. A client who has seen one recognises the other as the same product, and the next app costs less to build than the first.

// What changes on the ground

Month-end, before and after.

Before
By hand: exports pasted into spreadsheets and reconciled
Late: the line that needed a decision is found weeks after
Doubt: nobody is quite sure the report ties to the ledger
After Prudeon
One run: the pack is built straight from the ERP
Ranked: what crossed a threshold, ordered by what it is costing
Checked: reconciliation to your own figures, printed on every run

What it is worth depends on your own process. The assessment shows what your data supports.

// What else we build

Other things we build.

We also build booking and tracking systems, workflow and approvals, internal tools, and AI assistants that work on your own documents and data. Same portal, same sign-in, same licence.

If the thing you need has never been built before, that is what the assessment is for.

Want one of these pointed at your own data?

A paid assessment comes first: a fixed scope look at a copy of your own database and what is worth building against it. You get written findings in your own figures, every data quality problem ranked, and a fixed price for the build.

You talk to the person who writes the code. There is no account manager.